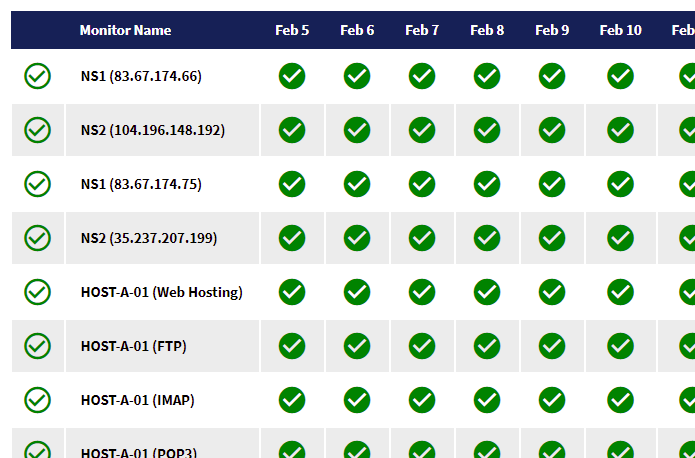
Not everyone who uses the Server Check Monitoring System knows that it has a built-in web server that allows for remote viewing of monitor stats and monitor reports, as well as daily and monthly uptime pages which can be used for public uptime pages.
The web server is part of Server Check and doesn’t require additional stacks or software to be installed – there’s no need to have Apache or IIS running, and no need for PHP or MySQL. Everything you need is built right into Server Check. You can even add an SSL/TLS certificate (in PFX format) to the web server configuration so that all web pages can be served securely.
The best thing about all this is that the web server is fully functional even in the FREE versions of Server Check!
The web server configuration settings built into Server Check allow users to select which monitors are displayed, select which types of monitors are displayed, restrict the web pages to show only monitors with particular information or statuses (for example, show only healthy monitors and exclude any that are failing or failed), and so on. The stats pages will show all monitors that have the web feature switched on and that match the selections in the web server configuration.
However, a company might want to make the stats for one (or selected) monitor(s) available to view without showing all the others that are set up in their Server Check installation (for example, if you’re a web hosting reseller or web developer and want to allow customers to view the stats for their own web sites only).
We’ve now added a new feature that makes this exact feature available to all Server Check users. It’s ready to go in the latest version (which you can download here). The new unique URL codes allow individual, specific monitors to be viewed in the stats web pages, easily and quickly.
Let’s see how this works.
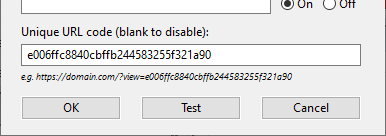
Define your unique URL code in the monitor edit panel:

Note: when adding new monitors, a unique code will be automatically generated but you can change this if you wish to.
The monitor can now be viewed by visiting the URL of your Server Check installation, plus the URL of the stats page you want to view, plus the unique code as a “?view=” query string key/value pair in the URL. For example, if your IP address is “1.2.3.4” and your default daily stats page URL is “/daily” then a specific monitor’s unique URL would look something like this:
https://1.2.3.4/daily?view=e006ffc8840cbffb244583255f321a90
Note: the base URL of your Server Check installation may be an IP address, or a domain name if you have set this up in your DNS correctly and opened/forwarded the correct port for the web server configuration.
The query string key “view” can also be abbreviated or omitted, as in these examples:
https://1.2.3.4/daily?v=e006ffc8840cbffb244583255f321a90
https://1.2.3.4/daily?e006ffc8840cbffb244583255f321a90
Multiple monitors can also be viewed at once by including commas between each code, for example:
https://1.2.3.4/daily?view=mysmtpserver,customer2,sqlserver
As you can see, this feature is extremely useful for sharing stats with different customers, departments, or for creating different views and combinations of stats pages.
The unique URL codes allow monitor stats pages to be visited even when your main default pages are password protected (if you have this configured in the Web Server settings panel). This way, you can still see all stats and results securely as an admin, whilst clients can visit their unique URLs without needing any log in details – they just need the URL you provide to them. If you wish to disable this type of access, simply leave the monitor’s unique URL code blank and the URL will no longer work.