Server Check version 1.5 was released quite a while ago, so here’s a quick run-down of all the major changes and updates.
There’s actually been a huge amount of things that have changed in the last few releases and version updates, and it would be silly to list them all here – that’s what the changelog is for!
However, there have been a few significant and major changes – things that have improved or added to the feature-set, functionality and reliability.
We changed the log file format to CSV, which makes them a little more friendly for reading and searching. Previously the log files were in plain text. It’s a little change, but will make things neater for everyone.
We added a setting to define the HTTP User Agent string for all HTTP requests. This way you can make Server Check look like a particular browser, a bot or give it your own unique name (although some servers might not like this!). You can also set the URL of Server Check’s built-in web server, and view the various web pages by choosing these from the “Web Pages” menu.
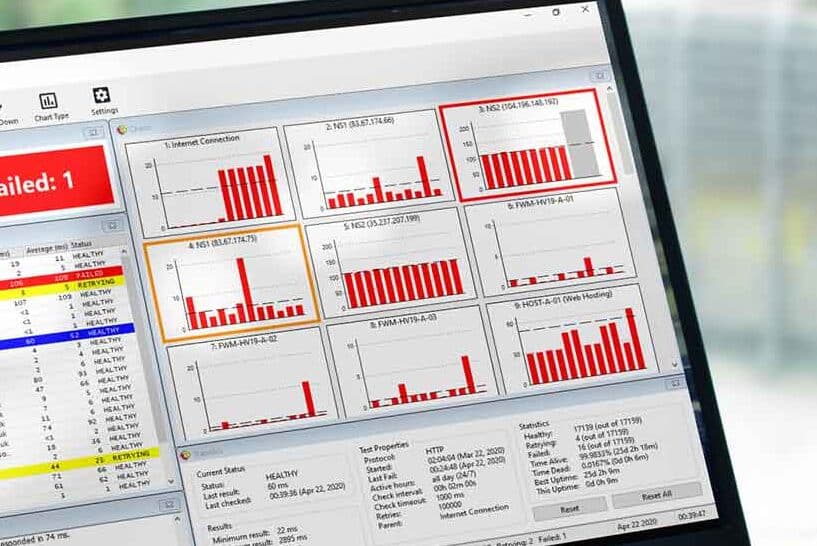
The summary charts in the main GUI can now display more than the 12 results they used to be limited to – you can select 12, 24 or 36 results. Of course, double-clicking on any of these charts will show the larger results chart with more results displayed – 50, 100, 250 or 500, depending on your chart settings.
We added a configuration report generator – which you can use to send us information about your Server Check installation when you contact us for support. This is also useful to see some of the raw configuration data for your installation.
GZIP encoding was enabled for all HTTP monitor requests, although this initially suffered from reliability issues. After we updated the GZIP library that Server Check uses, these reliability issues have been completely resolved and if you haven’t already, we’d recommend updating to the most recent release of the software just for this reason alone.
You can also optionally include or exclude the time taken to send HTTP requests to remote servers in the HTTP response times. For example, it may take 20ms for your system to contact a remote server and initiate an HTTP request, before the remote server starts sending anything back. Once it does, if this takes another 50ms, as an example, the total reported time would be in the region of 70ms, whereas the server actually only took around 50ms to do what it had to do. This setting allows you to decide if you want the timings to report how long everything takes, or to report only the timings related to receiving a response from your remote servers.
HTTP requests can now be set to follow redirects (301, 302, 307 and 308 responses) which can be useful if you make some configuration changes to your URLs or an SEO change means you need to monitor both old and new URLs and check they are both still valid.
We also added the HTTP HEAD request method, which can be selected alongside HTTP GET and HTTP POST request methods. For HTTP monitors, this means you can ask the remote server to send only the headers for a page, instead of having to download the entire page data, if it is not required. This could be a useful way to test if your web site is “awake” without always downloading the full page, particularly if you are working with limited bandwidth or you don’t want to add to your server’s load in a significant way.
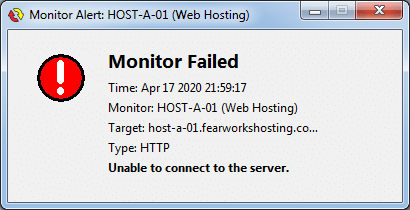
One of the more significant newer features stems from the many requests we received to enable the on-screen alert panels to self-destruct or tidy themselves away. We have enabled this in two different but very useful ways. The administrator can set on-screen failure alerts to disappear after a certain amount of time, regardless of whether the monitor has returned to a healthy state or not. Alternatively, the administrator can set these alerts to remain displayed until the monitor becomes healthy again, at which point, they can be set to disappear. Previously, the failure alerts stayed on screen once a monitor had failed, and did not disappear until the user closed them.
We also introduced the “Time Until Parent Is Stale” setting, which we have written about here. Put simply, this allows you to set up a parent monitor and have it always run before any of the child monitors, and allows you to determine how much time can pass between the parent monitor running and the child monitor running before the result from the parent monitor is classed as “stale” and needs checking again.

With some older releases of Server Check, depending on the version number, monitor sets were either saved as encrypted or unencrypted files, but this was not selectable. More recently, we added the option for you to choose whether you want the monitor sets to be saved with or without encryption. This might be a personal choice or determined by company policy, however the decision now lies with the Server Check system administrator.
An Internet Connection Test has been added so that you can test if a firewall is causing issues with allowing Server Check to send out requests for monitoring, as well as check if Server Check’s own built-in web server is accessible from your WAN and the internet.
With the latest release of Server Check, crashes should be very rare – but if they do happen, we have added the option for the software to restart automatically where possible, and also for anonymous crash and error information to be sent to us so that we can continue to improve the software. Sending this data to us is fully automatic but it is also optional, so you can disable this setting completely if you do not wish to participate.
Finally, there have also been lots (and lots!) of fixes and improvements made. Server Check is now better than ever, and we would encourage you to update to the latest version right now to take advantage of all of the latest and greatest features and the best reliablity.
Don’t give down-time a chance – let Server Check keep an eye on everything!